Scroll depth tracking has always been a crucial metric for businesses, marketers, and site owners. It helps you see how far users scroll down a page, and understand the content performance, engagement levels, and areas for improvement.
Yet, setting up scroll tracking has always been a tedious process – no matter which tool you switched to. For instance, Google Analytics 4 (GA4) only offers basic tracking at 90% depth as part of their enhanced measurement, which is only useful in knowing whether visitors are scrolling all the way down or not.
To track other percentages, like 25, 50 or 75 percent, you need to set up custom events in Google Tag Manager, which involves a learning curve and requires time and patience.
Whereas other alternatives either don’t allow tracking this metric or require complicated and technical setups and/or custom reporting to track scroll depth.
At Plausible, we’ve simplified this completely. Scroll depth tracking is now built into our analytics by default, requiring no setup or additional configurations.
We automatically track and display all percentages to which your visitors scroll to. Available at no extra cost, this feature is live in your dashboard and ready to provide actionable insights.
- What is scroll depth?
- Introducing, automatic scroll depth tracking in Plausible Analytics
- What’s wrong with other web analytics tools’ scroll tracking?
- What is a good scroll depth?
- Ready to track your page scrolls?
What is scroll depth?
As the name suggests, scroll depth is the vertical length to which a visitor scrolls a particular page on your website. This metric is often reported as a percentage, such as 25, 50, 75, or 90 percent.
If they scroll down all the way down to the page (generally including the footer), it’s a 100% scrolling event. If half, 50%. And so on.
This insight helps you:
- Understand how visitors interact with your content, identifying which sections capture attention and which are overlooked.
- Optimize content placement by determining the ideal locations for important elements like calls-to-action, ensuring they are positioned where users are most likely to see them.
- Improve page layout by analyzing scroll patterns.
For example, if you’ve got a long-form article with a call-to-action (CTA) near the bottom, scroll depth can tell you how many of your readers actually made it to that point.
This is also measured in pixels (usually rounded off values) in some tools. Although, it’s better to track it in percentages because that way it’s easier to judge the engagement level of the page and easily compare it to other pages too.
Introducing, automatic scroll depth tracking in Plausible Analytics
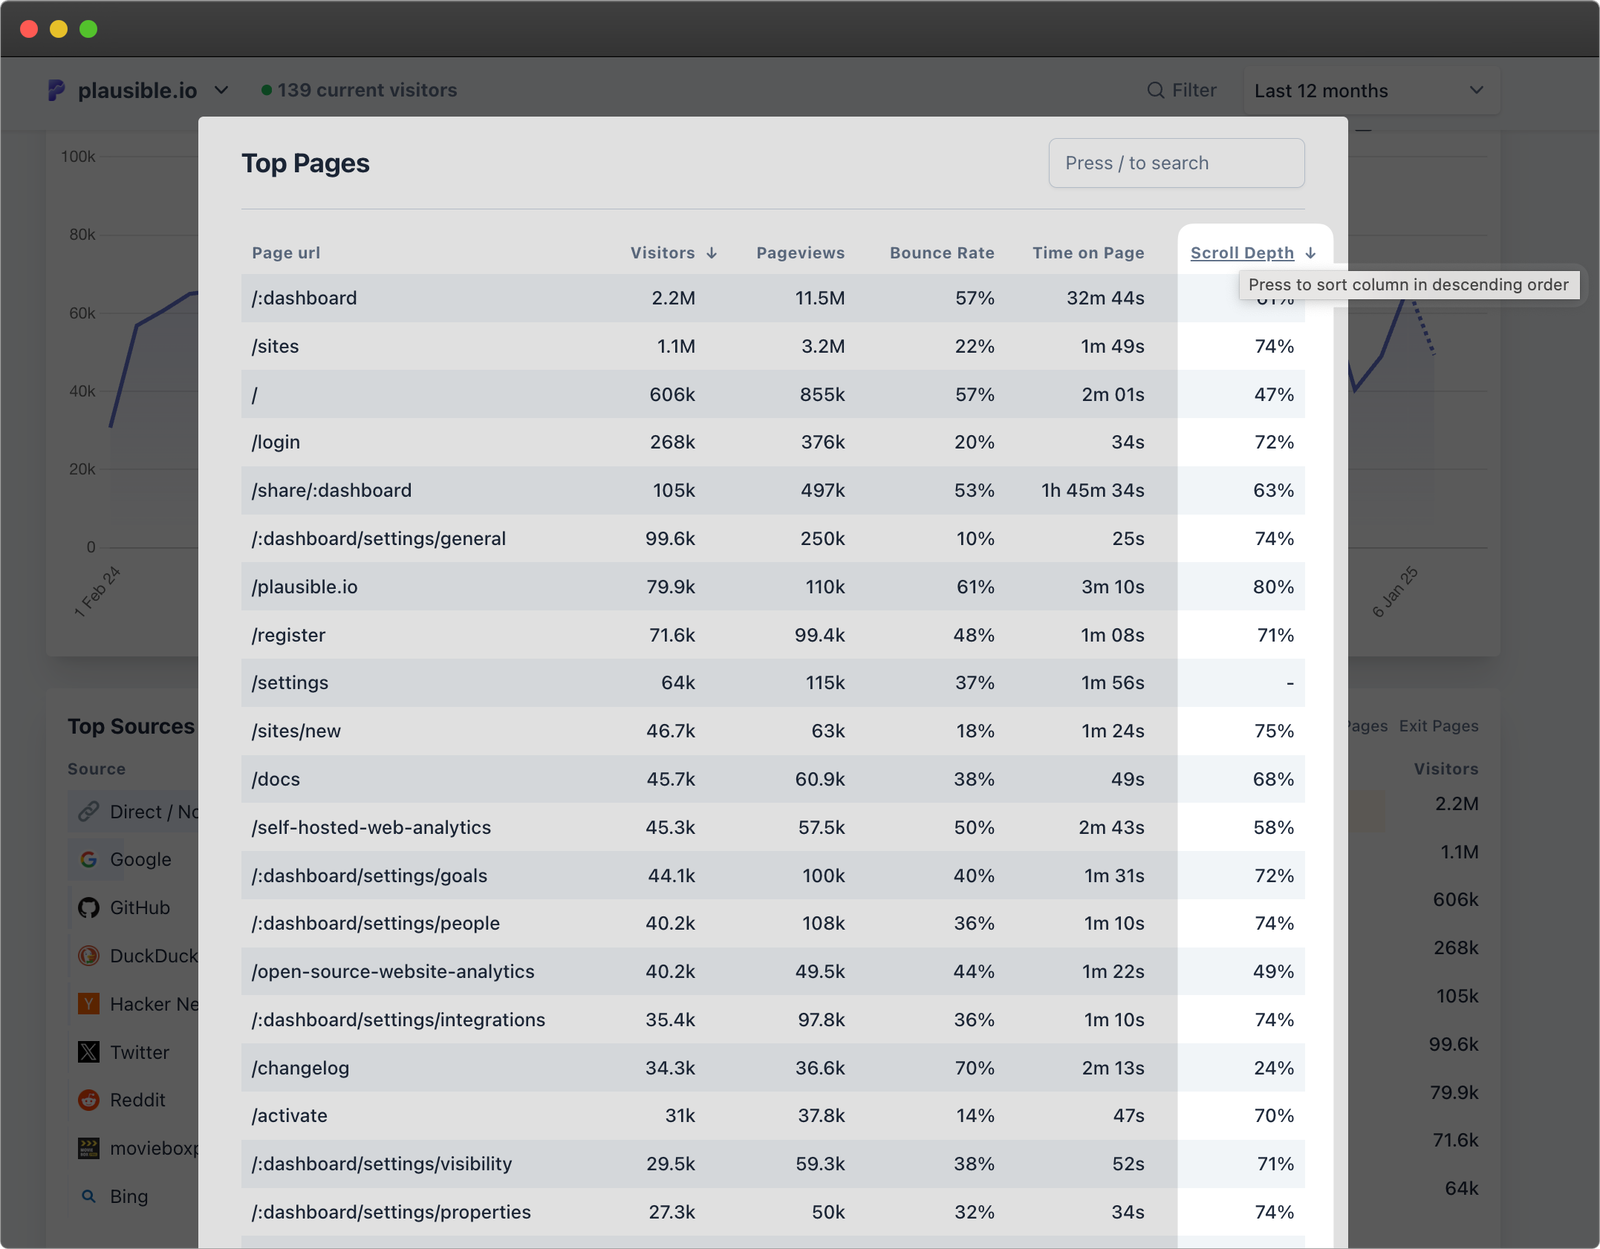
The scroll depth metric is now live in your dashboards!
![]()
If you don’t have an account with Plausible, you can check out the Top Pages tab in our live demo to see what this looks like.
Here’s everything you need to know about it:
Tracked by default
Scroll depth is measured automatically for every page on your site that is tracked with the Plausible script.
No sending scroll depth events, no plugins, no tag managers, no extra cost, no extra time and effort.
This is a rare feature that you won’t easily find in any other web analytics tool.
Tracked at all page heights
We track page scrolling at all scroll depth percentages: 1, 2, 3, 4,…33, 34, …67, 68, …, 98, 99, 100%.
It’s not limited to predetermined specific points only like 25, 50, 75, 90 percent – like some other tools.
Found with the Top Pages tab
You can find the scroll depth metric in two main areas of your dashboard:
- The top row of metrics in the dashboard, whenever a page filter is applied. You can click on the metric to display its performance over time on the line graph as well.
- The expanded **Top Pages tab (i.e. Details section)**, where you can even sort pages by scroll depth for deeper insights.
If there’s no data available yet, scroll depth will simply display as “-” until sufficient traffic is captured.
If you are new to Plausible, you can refer to the gif above to visualize this, or play around with our live demo.
Available with the official Plausible WordPress plugin
This metric is available with our official WordPress plugin as well.
Set your Scroll Depth goals
Scroll Depth goal tracking in Plausible goes beyond measuring how much of a page was scrolled.
You can set up a Scroll Depth goal with a specific scroll depth percentage threshold to see how many visitors scroll to and beyond your desired scroll depth mark.
To get started with Scroll Depth Goals, go to your website’s settings in Plausible Analytics and visit the Goals section.
See how here.

Group pages to see the average page scroll depth
Another thing you can do in the Plausible dashboard is group similar pages and see the average scroll depth for them.
For eg. If you want to see how much on an average do your blog posts have scroll depth, and you know that all your blog posts contain the word “blog” within the path of their respective URLs (as is the case with our website), then you can use the Filter option to filter such pages. Here is how:
Click the “Filter” option located beside the time period selector. This will open a dropdown, where you can select the first option that says “Page.” This will open a modal as shown in the following screenshot.
Open the dropdown list located below the “Page” section and select the “contains” operator. Type a word like “blog” (like the example above). Click the “Apply Filter” button.

This way, your dashboard will show the average scroll depth for only the blog posts on your website, which happens to be 52% for the last 30 days in the case of our website:

By the way, if you pay closer attention to this example, you’ll see that only the pages containing the word “blog” in their URLs are being displayed in the “Top Pages” report.
What’s wrong with other web analytics tools’ scroll tracking?
Other web analytics tools:
- Either don’t allow tracking the scroll depth metric, such as Cloudflare Analytics amongst others,
- Or require complicated and technical setups and/or custom reporting to manage, track and view their scroll depth data.
Let’s take a look at Matomo and Google Analytics, which are popular choices for web analytics.
How to track scroll depth in Matomo?
Matomo offers three ways to track scroll depth:
- Install the Matomo Heatmaps and Session Recording plugin. Then, by viewing the heatmaps, you’d be able to automatically see how far down visitors scroll on your pages.
- Use the Matomo Tag Manager. Matomo has its own tag manager, like the Google Tag Manager. To see scroll depth data in your Matomo dashboard, you’d need to create a new tag, configure the event with specific scroll depth percentages, and set up the appropriate trigger.
- Manually track scroll percentage using a JavaScript code on your website.
P.S. We also have a list of other similarities and differences between Plausible and Matomo as web analytics tools for your easy analysis.
How to track scroll depth in Google Analytics?
Google Analytics has been the default choice for web analytics for years. Yet, the built-in scroll tracking (available as an enhanced measurement, which also needs to be turned on manually) in GA4 continues to be limited as it only allows tracking at 90% scroll depth.
This is only useful in knowing whether visitors are scrolling all the way down or not. Therefore, the solution suggested by GA experts is to disable it entirely and implement a more customized solution within Google Tag Manager.
Here is an overview of the steps to do so:
- Disable scroll tracking in the GA4 interface.
- Configure a new scroll depth trigger in Google Tag Manager. Go to Triggers -> New -> Scroll Depths -> Vertical scroll depths -> Percentages -> enter values for which you want to track scrolling depth. Name the trigger and save it.
- Test your trigger using the debugger and preview mode and verify the setup by checking whether the data is correctly collected in the data layer.
- Create a new tag in GTM by selecting the tag type as a GA4 event, selecting the relevant configuration tag from the dropdown. Enter the event name, set event parameters. Choose the triggering. Name and save the tag.
- Open GA4 and to test your setup with the debugview.
- Create a custom dimension in GA4 settings. Decide the dimension name and scope. Select the relevant parameter (earlier setup within GTM). Save it. Wait for 24 hours, it’ll be available in your reports. By the way, you can have up to 50 custom dimensions only.
As you can see, this setup is time-consuming and tricky for those unfamiliar with Google Analytics and Tag Manager. You’ll need to test rigorously and need to maintain your setup over time as both your website and GA evolve.
Many engage freelancers and agencies to help with such setups, which is expensive and time-consuming. There are many other things that are much easier to do in Plausible than Google Analytics 4.
What is a good scroll depth?
There isn’t a universal “good” scroll depth because it depends on the purpose of the page in question. For a blog post, you’d ideally want most users to reach at least 75% of the page, as that’s where the conclusion or CTA often resides.
On landing pages, especially ones designed for conversions, more than 70-90% scroll depth can be the goal, as it signals that users are understanding about the offering and reaching the final CTA or contact form.
Similarly, if most users drop off before 25%, it might indicate issues with your header or introduction. But, if you have a CTA around that mark and your bounce rates are low, it could also indicate that the visitors converted around that time.
Or if engagement drops significantly at 50%, perhaps your content isn’t holding attention, or the layout is causing friction. If many users aren’t even scrolling down below the 10% mark, then probably you targeted the wrong audience.
So, it all depends! This is why you need a dashboard to compare all metrics and make meaningful conclusions.
In Plausible, you can club this metric with other metrics such as time on page and bounce rate to understand the engagement patterns properly. This can be measured against the visitors and pageviews, amongst other things. You can even pair scroll‑depth tracking with A/B test variations to see which layout/content/CTA placements yields deeper scrolls.
Ready to track your page scrolls?
Plausible prioritizes simplicity, privacy and accuracy – all at the same time. Our goal is to remove unnecessary complexity while providing the insights you need to improve your website and business.